Dedicated API statistics
Fire provides an open banking v3.1 dedicated API for TPPs to access Fire Business and Fire Personal accounts.

Daily uptime statistics 2025-Q4
The graph below shows the daily uptime for Fire Business web application, the Fire Personal apps and the Fire dedicated interface. The raw data for the chart is available from the CSV download option.

Daily uptime statistics 2025-Q3
The graph below shows the daily uptime for Fire Business web application, the Fire Personal apps and the Fire dedicated interface. The raw data for the chart is available from the CSV download option.

Daily uptime statistics 2025-Q2
The graph below shows the daily uptime for Fire Business web application, the Fire Personal apps and the Fire dedicated interface. The raw data for the chart is available from the CSV download option.

Daily uptime statistics 2025-Q1
The graph below shows the daily uptime for Fire Business web application, the Fire Personal apps and the Fire dedicated interface. The raw data for the chart is available from the CSV download option.

Daily uptime statistics 2024-Q4
The graph below shows the daily uptime for Fire Business web application, the Fire Personal apps and the Fire dedicated interface. The raw data for the chart is available from the CSV download option.

Daily uptime statistics 2024-Q3
The graph below shows the daily uptime for Fire Business web application, the Fire Personal apps and the Fire dedicated interface. The raw data for the chart is available from the CSV download option.

Daily uptime statistics 2024-Q2
The graph below shows the daily uptime for Fire Business web application, the Fire Personal apps and the Fire dedicated interface. The raw data for the chart is available from the CSV download option.

Daily uptime statistics 2024-Q1
The graph below shows the daily uptime for Fire for Business web application, the Fire Personal apps and the Fire dedicated interface. The raw data for the chart is available from the CSV download option.

Daily uptime statistics 2023-Q4
The graph below shows the daily uptime for Fire Business web application, the Fire Personal apps and the Fire dedicated interface. The raw data for the chart is available from the CSV download option.

Daily uptime statistics 2023-Q3
The graph below shows the daily uptime for Fire Business web application, the Fire Personal apps and the Fire dedicated interface. The raw data for the chart is available from the CSV download option.

Daily uptime statistics 2023-Q2
The graph below shows the daily uptime for Fire Business web application, the Fire Personal apps and the Fire dedicated interface. The raw data for the chart is available from the CSV download option.

Daily uptime statistics 2023-Q1
The graph below shows the daily uptime for Fire Business web application, the Fire Personal apps and the Fire dedicated interface. The raw data for the chart is available from the CSV download option.

Daily uptime statistics 2022-Q4
The graph below shows the daily uptime for Fire Business web application, the Fire Personal apps and the Fire dedicated interface. The raw data for the chart is available from the CSV download option.

Daily uptime statistics 2022-Q3
The graph below shows the daily uptime for Fire Business web application, the Fire Personal apps and the Fire dedicated interface. The raw data for the chart is available from the CSV download option.

Daily uptime statistics 2022-Q2
The graph below shows the daily uptime for Fire Business web application, the Fire Personal apps and the Fire dedicated interface. The raw data for the chart is available from the CSV download option.

Daily uptime statistics 2022-Q1
The graph below shows the daily uptime for Fire Business web application, the Fire Personal apps and the Fire dedicated interface. The raw data for the chart is available from the CSV download option.

Daily uptime statistics 2021-Q4
The graph below shows the daily uptime for Fire Business web application, the Fire Personal apps and the Fire dedicated interface. The raw data for the chart is available from the CSV download option.

Daily uptime statistics 2021-Q3
The graph below shows the daily uptime for Fire Business web application, the Fire Personal apps and the Fire dedicated interface. The raw data for the chart is available from the CSV download option.

Daily uptime statistics 2021-Q2
The graph below shows the daily uptime for Fire Business web application, the Fire Personal apps and the Fire dedicated interface. The raw data for the chart is available from the CSV download option.

Daily uptime statistics 2021-Q1
The graph below shows the daily uptime for Fire Business web application, the Fire Personal apps and the Fire dedicated interface. The raw data for the chart is available from the CSV download option.

Daily uptime statistics 2020-Q4
The graph below shows the daily uptime for Fire Business web application, the Fire Personal apps and the Fire dedicated interface. The raw data for the chart is available from the CSV download option.

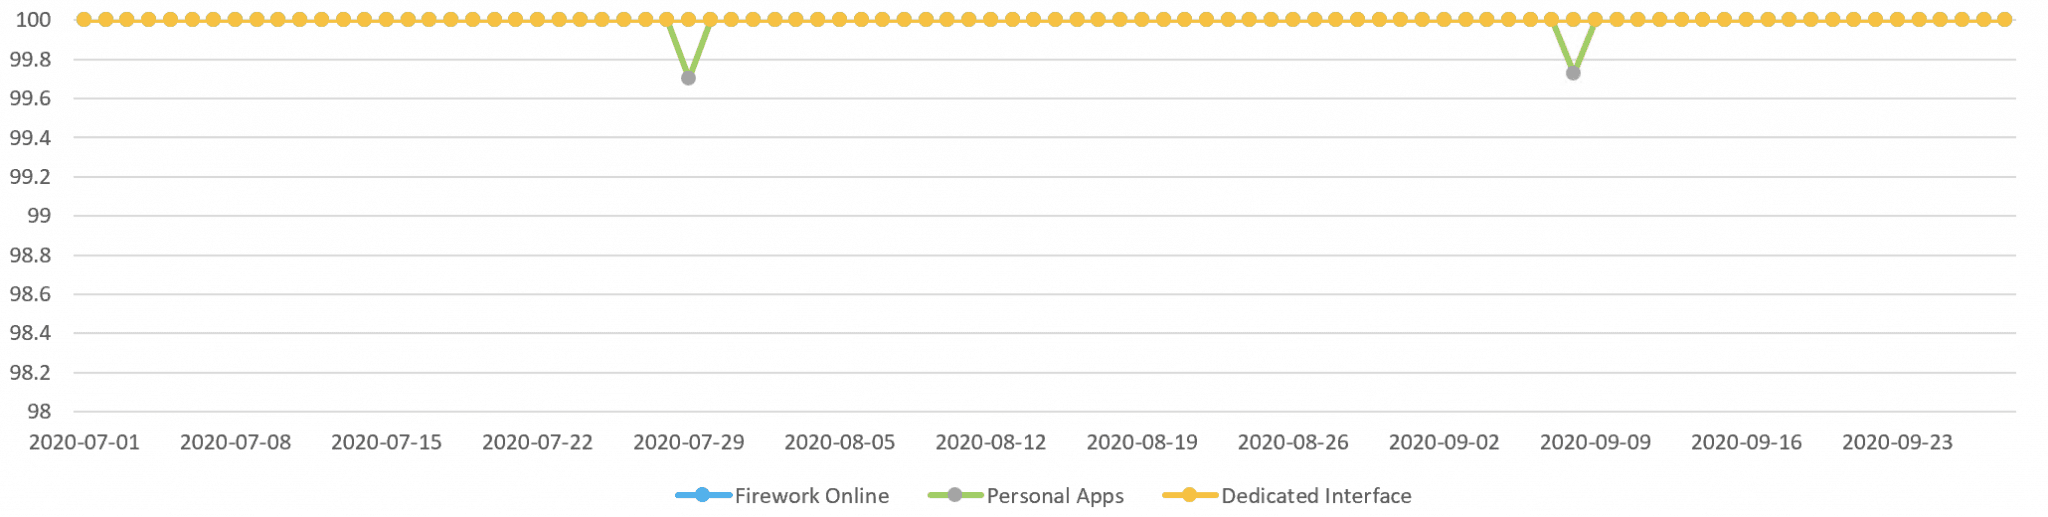
Daily uptime statistics 2020-Q3
The graph below shows the daily uptime for Fire Business web application, the Fire Personal apps and the Fire dedicated interface. The raw data for the chart is available from the CSV download option.
Daily uptime statistics 2020-Q2
The graph below shows the daily uptime for Fire Business web application, the Fire Personal apps and the Fire dedicated interface. The raw data for the chart is available from the CSV download option.

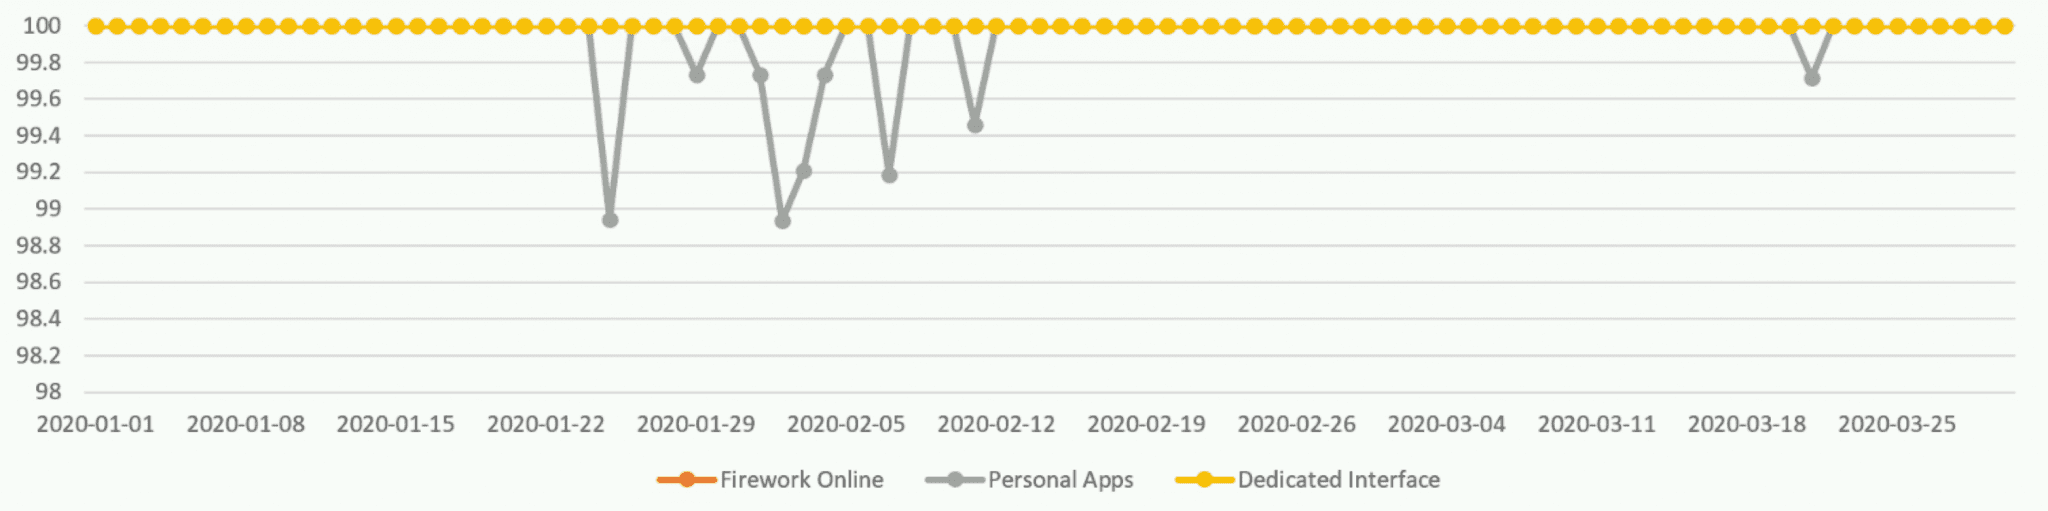
Daily uptime statistics 2020-Q1
The graph below shows the daily uptime for Fire Business web application, the Fire Personal apps and the Fire dedicated interface. The raw data for the chart is available from the CSV download option.
Daily uptime statistics 2019-Q4
The graph below shows the daily uptime for Fire Business web application, the Fire Personal apps and the Fire dedicated interface. The raw data for the chart is available from the CSV download option.
